|
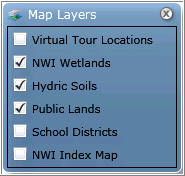
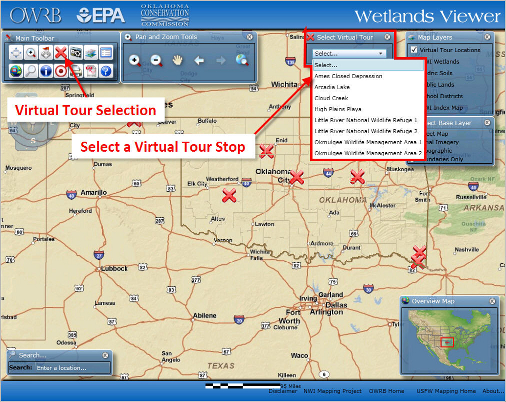
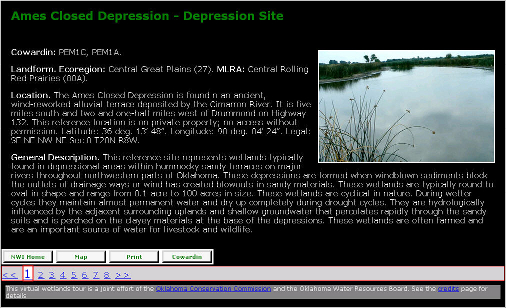
The Wetlands Viewer has several different map layers that the user can turn on and off. This tutorial outlines the different map layers. The Map Layers window should be open by default. To change the visibility of a map layer, check or uncheck the box next to the layer name. Virtual Tour Location – This layer shows the locations of the wetlands virtual tour stops. NWI Wetlands – National Wetland Inventory (NWI) wetland polygons. You must be zoomed into the map before this layer will become visible. NWI Wetlands data can be downloaded or viewed in other formats from the U.S. Fish & Wildlife, National Wetlands Inventory. Hydric Soils – This layer is a subset of the NRCS SSURGO soils dataset. Hydric soils are a key indicator for wetlands identification. The SSURGO soils dataset can be downloaded from the Natural Resources Conservation Service (NRCS), Soil Data Mart. Public Lands – The vast majority of wetlands in Oklahoma reside on private lands. This layer is provided to show users where they visit publicly accessible wetlands. School Districts – This layer allows students and educators to quickly find and zoom to their school district. The Oklahoma School Districts dataset can be downloaded from the Center for Spatial Analysis NWI Index Map – This index layer shows the outline, name and index number of each NWI quadrangle map. This map layer contains eight wetlands virtual tour locations. There are several different types of wetlands in Oklahoma. Each tour stop has a detailed description of the physical characteristics that makeup that particular wetland type. These include; physical location and general description, wetland functions, vegetative community, hydrology, hydrologic indicators, soil, and wetland dependant wildlife species. Viewing a Wetlands Virtual Tour Locations In the Map Layers window, check the box to make the Virtual Tour Locations visible in the map. From the “Select Virtual Tour” window, click the “Select…” drop-down and select the Virtual Tour Location that you would like to visit.
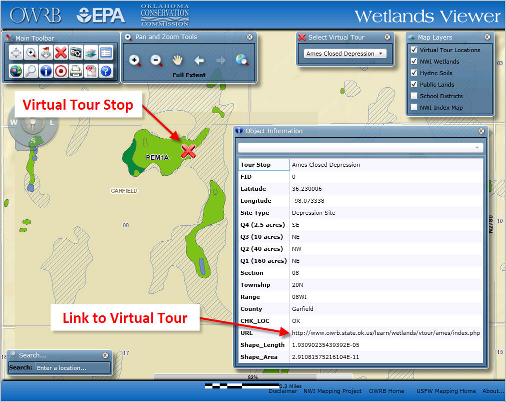
Once you select the site the map will zoom into its location and open the “Identify Results” window.
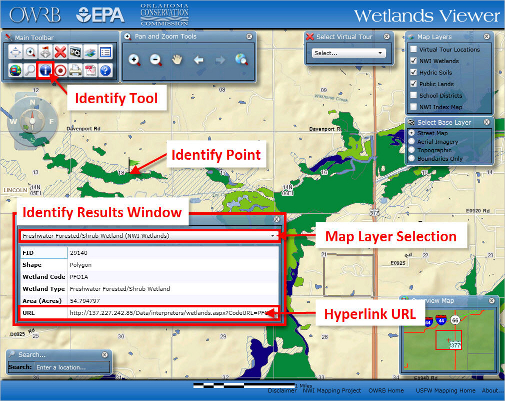
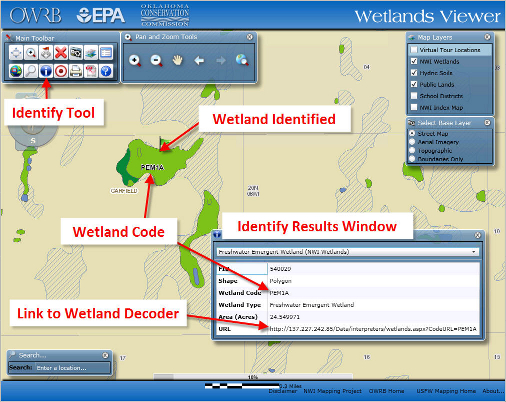
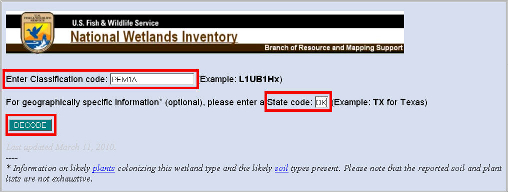
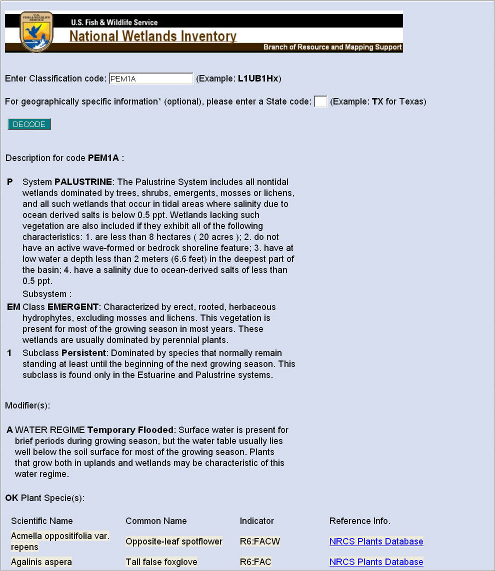
At the bottom of the “Identify Results” window, click the “URL” link. This will launch the virtual tool application for this site. The Identify Tool allows the user to view additional information about the selected feature. Select the Identify Tool and click the map feature you wish to identify. In the example above, the green flag represents a point clicked on a wetlands polygon. The Identify Results window displays information about the selected map feature. Click the drop-down arrow after the map layer name to get identify results from the other map layers. Some map layers have hyperlinks to additional information. In the example above, if you click on the web address in the URL field, a new web page will open displaying the USFW NWI Wetland Classification Decoder. This map layer contains the National Inventory of Wetlands (NWI) wetland polygons. The layer is maintained by the U.S. Fish and Wildlife Service (USFW). The wetland area represented were determined using aerial photography. It is important to note that many of these wetlands were delineated in the 1970’s and 1980’s and have not been updated since that time frame. Each wetland area has an associated wetland code that describes the wetland type. The example below will demonstrate how to decode the wetland type be using the Identify tool. View the Metadata for this map layer. The NWI Wetlands map layer is turn on by default, but is not visible until the user zoomed in past the county level. Tip: Zoom in until the value on the scale bar is equal to 5 miles or less. To turn the map layer on or off, click the check box next to the layer’s name in the Map Layers window. There are several ways to search and find wetland areas. These methods are described in the help documents “Map Navigation” and “Search and Identify Tools”. The Identify Results window will open displaying the attribute information about the wetland area. The Wetland Code is the Cowardin System Index Code describing the wetland type. Click on the web address link in the URL field to open the USFW’s Wetlands Code Interpreter. The Wetland code is automatically populated in the “Enter Classification Code” box. Enter the text “OK” in the “State code” box. Click the “Decode” button. The page will return a detailed description of the wetland type along with a list of plant species and soil types that may be associated with this wetland type.
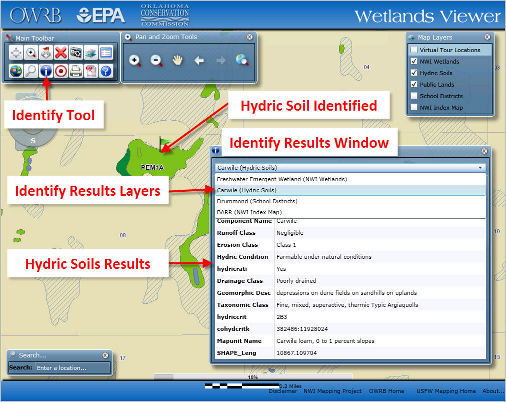
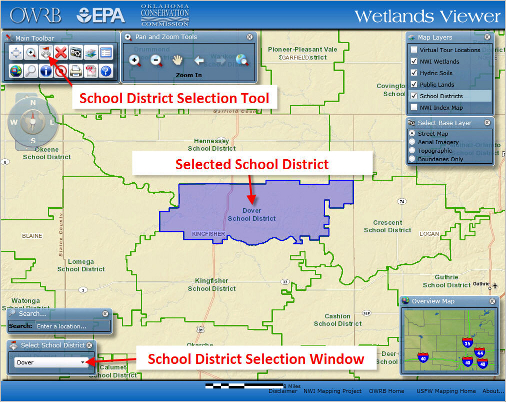
The Hydric Soils map layer consists of NRCS SSURGO Soils map units that have been classified as being “Hydric”. Hydric soils are those soils that are sufficiently wet in the upper part to develop anaerobic conditions during the growing season (NRCS Hydric Soils Overview). These soils can be key indicators when trying to identify potential wetland areas. View the Metadata for this map layer. The Hydric Soils map layer is turn on by default, but is not visible until the user zoomed in past the county level. Tip: Zoom in until the value on the scale bar is equal to 5 miles or less. To turn the map layer on or off, click the check box next to the layer’s name in the Map Layers window. The Hydric Soils map layer is set to display below the NWI Wetlands map layer. In some cases a Hydric Soils area may not be visible because it is overlapped by a wetlands area. Click on the top row of the “Identify Results” window. Change the results layer to: “soil name (Hydric Soils) layer. This will change the results from the top layer (NWI Wetlands) to the (Hydric Soils) layer. The School Districts map layer was added to the map viewer to help educators and students find their school districts. View the Metadata for this map layer. The School Districts map layer is turned off by default. To turn the map layer on, click the check box next to the layer’s name in the Map Layers window. You can quickly select and zoom to a school district by using the School District Selection tool. There are several other ways to search and find school districts. These methods are described in the help documents “Map Navigation” and “Search and Identify Tools”.
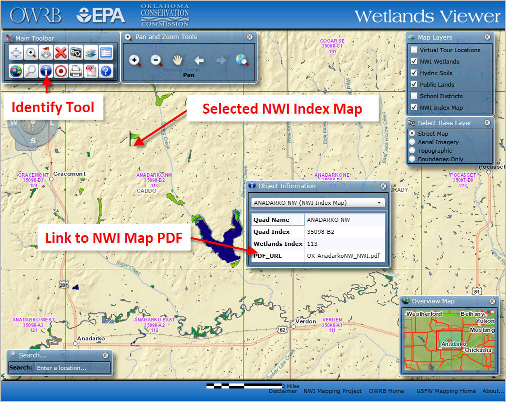
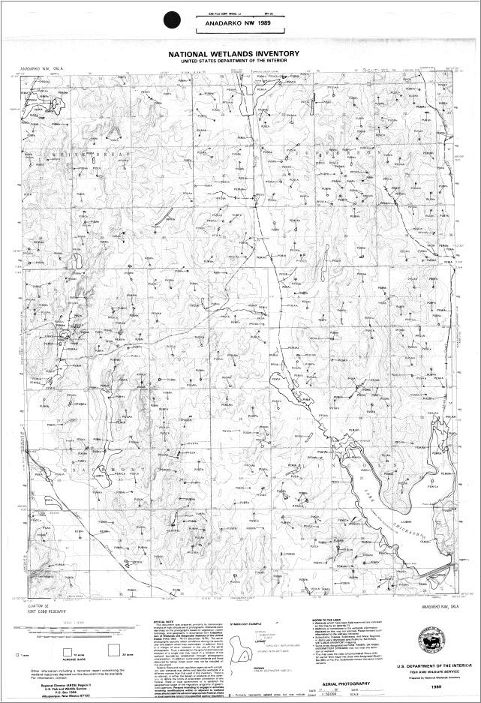
The NWI Index Map layer provides reference to the original NWI paper maps. The index quadrangles are the same as the USGS 7.5 minute topographic maps. View the Metadata for this map layer. The NWI Index map layer is turned off by default. To turn the map layer on, click the check box next to the layer’s name in the Map Layers window. Click on the top row of the “Identify Results” window. Change the results layer to: “NWI Index map name (NWI Index Map) layer. This will change the results from the top layer (NWI Wetlands) to the (NWI Index Map) layer. To open a scanned .pdf map image of the original NWI Wetlands map, click on the file name to the right of the “PDF_URL” field. *NOTE – The Adobe® Reader is required to view and print these documents. You may obtain a free copy of the reader software from Adobe's® Web Site. The .pdf will open in a new browser window and look similar to the image below.
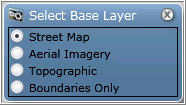
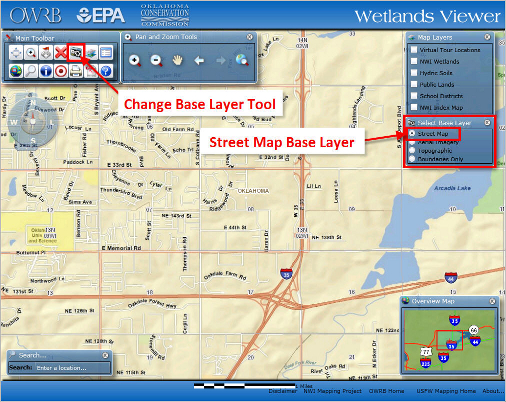
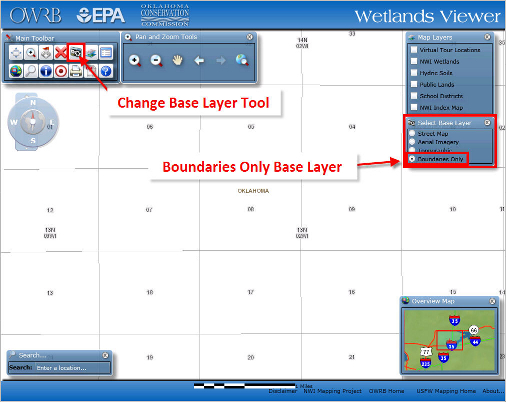
The Wetlands map viewer has four different base map backgrounds to choose from. The user can change the base map display by selecting the base map from the Select Base Layer window. The Street Map base layer is the default map background. This layer contains roads, hydrography, cities, places, and other geographic features. This base layer is a map service from the ESRI World Street Map service. For more information about this map service visit the ESRI web page.
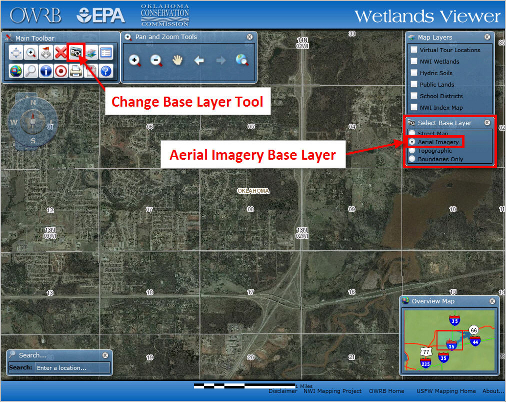
The Aerial Imagery base layer is a composite of satellite imagery and aerial photographs. This base layer is a map service from the ESRI World Imagery service. For more information about this map service visit the ESRI web page.
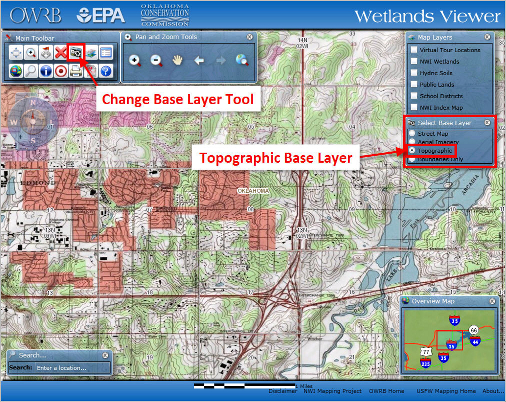
The Topographic base layer is a composite of the USGS topographic maps. This base layer is a map service from the ESRI USA Topographic Maps service. For more information about this map service visit the ESRI web page.
The Boundary Only base layer contains the Public Land Survey System (PLSS) townships and sections and city locations.
|
Disclaimer